Safety in Numbers: Benefits of Portfolio Diversification in Renewable Energy Investment
Owning and operating a single renewable asset, such as a wind farm, can prove to be risky for investors. Factors such as variable site conditions, seasonality (and, by extension, climate change) can all translate into an unstable and unpredictable return on investment. Those looking to enter the ring might consider diversifying their portfolio of assets in order to reduce financial risk.
In this analysis, we’ll cover:
- Benefits of diversification
- Wind and solar PV co-location
- Non-co-located projects
- Conclusions
- How ABL & OWC can help your projects
An investor can mitigate an individual asset’s risk by building a portfolio with low, or in the best case negatively, correlated assets (meaning that when some assets decrease in value, the other assets will increase in value, and vice versa).
The diversification of a renewable energy (RE) portfolio could refer to many aspects including, but not limited to:
- Diversification of RE technology, ie, onshore wind, offshore wind, solar PV, hydro, storage
- Climatic diversification, ie, wind resource, solar resource, water resource, temperature
- Market diversification, ie, policy certainty / uncertainty, alternative revenue streams
Typically, the largest uncertainty associated with the energy yield of a wind or solar RE project is due to the inter-annual variation (IAV) of the resource. Wind resource onshore is generally accepted to have a standard deviation of 5-7%, resulting in IAV in the energy yield of 10-15% or higher.
Consideration of the benefits of varying resource characteristics between wind and solar is not a new concept, and ABL provides portfolio benefit analyses to clients on a regular basis. These have historically focussed on the IAV with a view to reducing long-term portfolio uncertainty; however, with an increasing uptake of corporate / merchant / virtual Power Purchase Agreements (PPAs), the variation of output on a monthly basis or higher temporal resolution throughout the year is also being scrutinised. Some benefits of a more stable portfolio energy output could be:
- Securing an increased PPA price
- LCOE reduction due to lower debt finance costs
- Maximising the utilisation of a grid connection export capacity limit
As an example, Figure 1 below shows typical monthly variations in energy for a wind project (blue) and solar project (green) for two locations in Europe[1]. The resulting average energy is depicted by the dotted black line which indicates a far more stable monthly energy generation throughout the year.
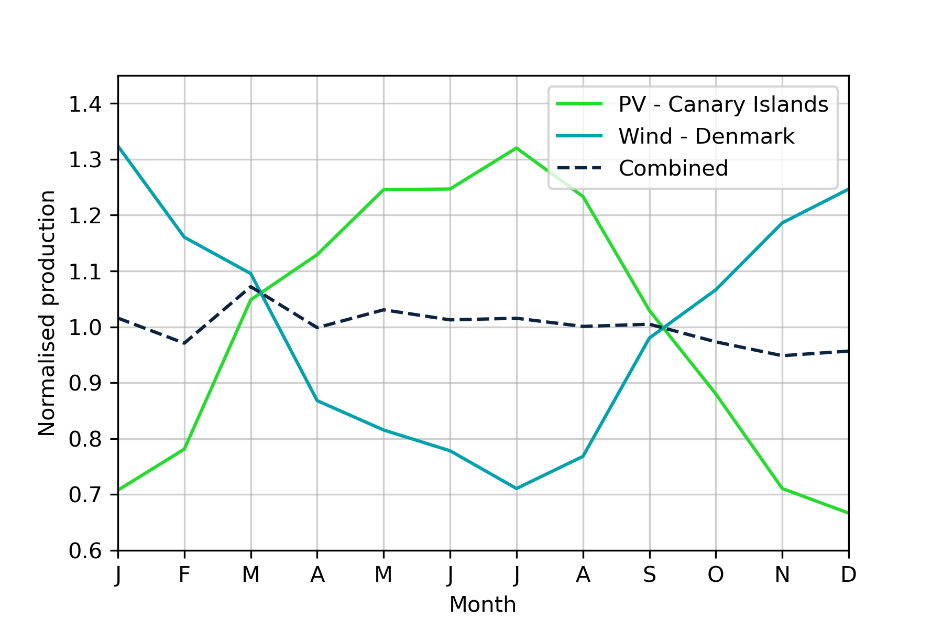
Figure 1 paints an optimistic picture of the portfolio, since the project locations are far from each other (ie, not delivering low variability energy to the same market), and the data is a long-term average / typical meteorological year view, rather than from any specific year. However, the concept of achievable benefits across a portfolio remains of interest.
Benefits to diversification
ABL has undertaken many conceptual studies, based on a range of locations across Europe, in an attempt to identify attractive combinations of onshore wind and/or solar PV projects. We have looked at co-location of wind and solar PV projects in addition to assessing the benefits of multi-technology portfolios across different markets. Metrics that have been considered include IAV of energy production, monthly variability throughout the year and diurnal variation.
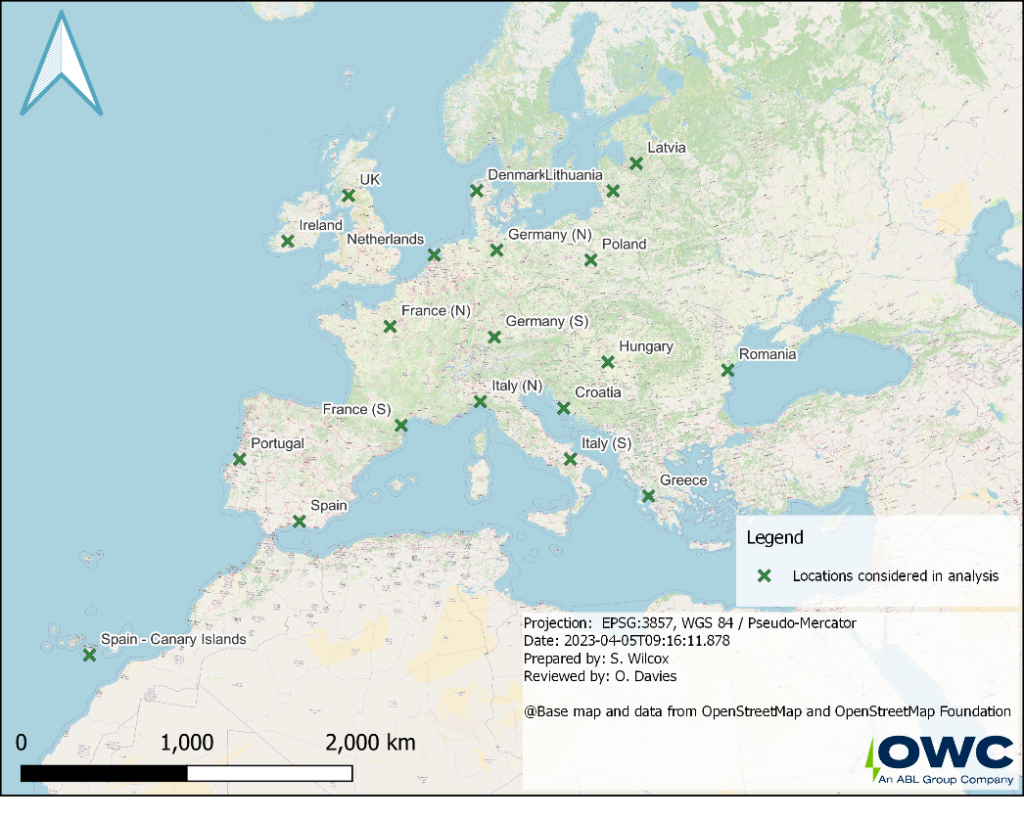
The locations considered by ABL are as shown in Figure 2 below. While this range captures only a small fraction of the many distinct climatic conditions across Europe, it provided a broad spread of results for this theoretical analysis. It should be noted that Scandinavian countries were not included in this analysis due to the low solar irradiation conditions. Nevertheless, the distinct wind climates of these countries may provide further benefit through complementary profiles when compared to other European locations.
Wind and solar PV co-location
An attractive concept is the co-location of wind and solar PV projects. Where the generation profiles (diurnal, monthly, annual) are complementary, the benefits of co-location can be significant. The ability to utilise a greater percentage of a grid connection maximum capacity for greater periods of time can provide lower Capital Expenditure (CapEx) and therefore Levelised Cost of Energy (LCOE) for the second project (ie, not requiring additional grid connection / infrastructure costs), and more stable revenue streams are favoured by all invested parties.
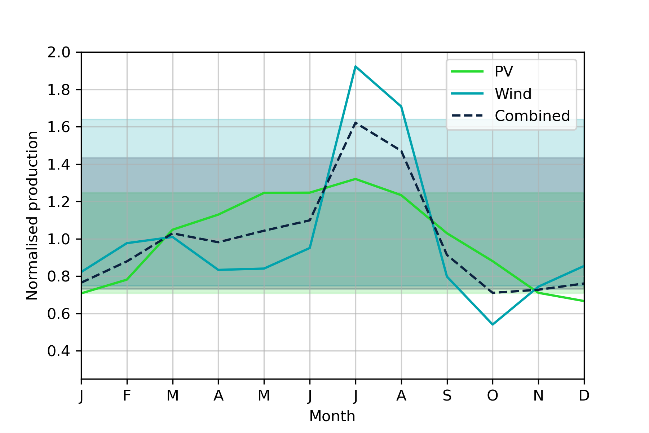
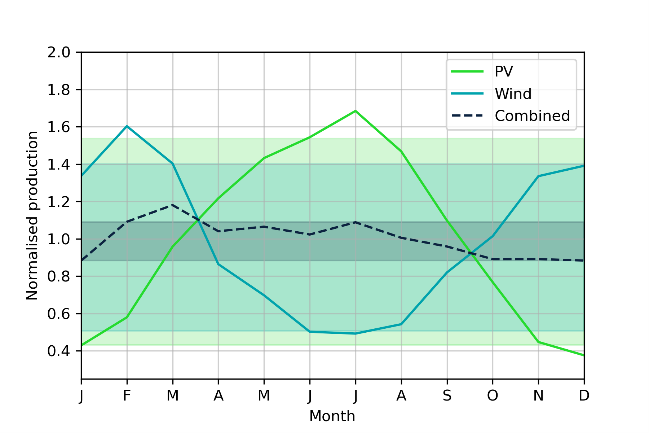
It should be noted, however, that co-location may not always be beneficial. As an example, Figure 3 below depicts the monthly generation variation of a wind project and a solar PV project, both located in the Canary Islands. It is apparent that the summer energy production is generally higher than the winter production for both technologies. The coloured bands on the graph depict a P90 / P10 level for each of the technologies individually and when combined. Conversely, Figure 4 shows the impact of a highly successful co-location based on the Croatia datapoint. The spread of the P90 bands on the resulting combined energy profile are considerably reduced when compared to the wind or solar PV projects in isolation.
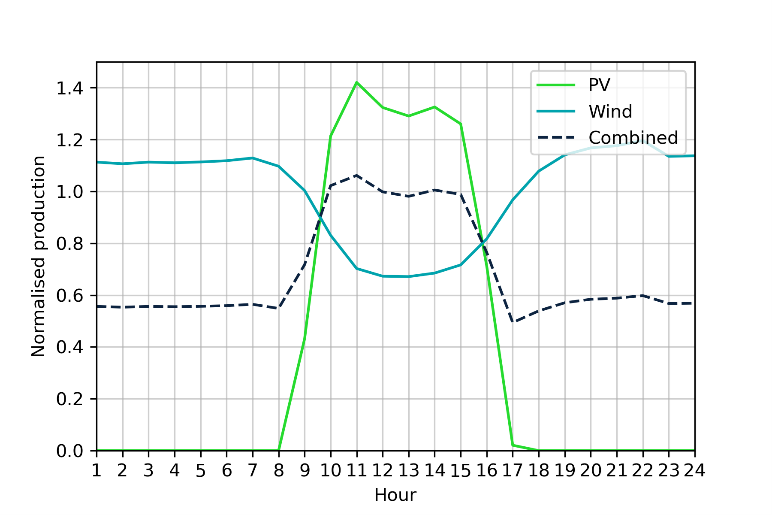
Benefits can also be observed on a diurnal basis where the wind energy drops off during the day and increases overnight, providing a more stable output over a 24-hour period. At this temporal resolution, identifying optimised locations becomes more complex due to the high variability in output, especially from solar PV projects both diurnally and monthly. Depending on project or PPA conditions, specific energy generation profiles can be identified to comply with certain requirements. This could be baseload power guarantees at certain times of day or year, increased generation at times of peak load / demand, or other obligations. An example of moderately complementary diurnal profiles is given in Figure 5 below.
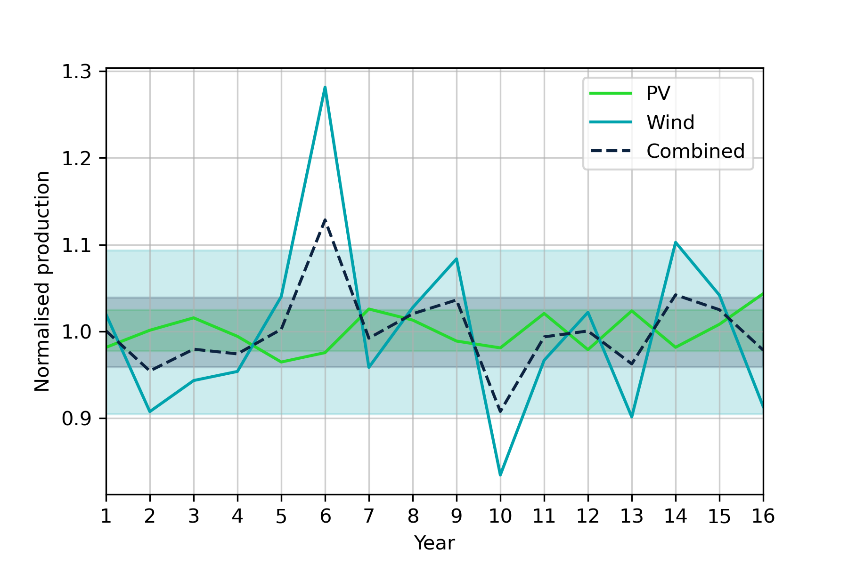
In terms of more traditional portfolio benefit metrics, co-location can also reduce the IAV of energy. For example, the solar and wind resource variability for the Greek data node location is somewhat complementary, as can be seen in Figure 6 below. Whilst the solar PV IAV is already quite low, the addition of the project to an existing wind project would result in a reduced IAV.
Non-co-located projects
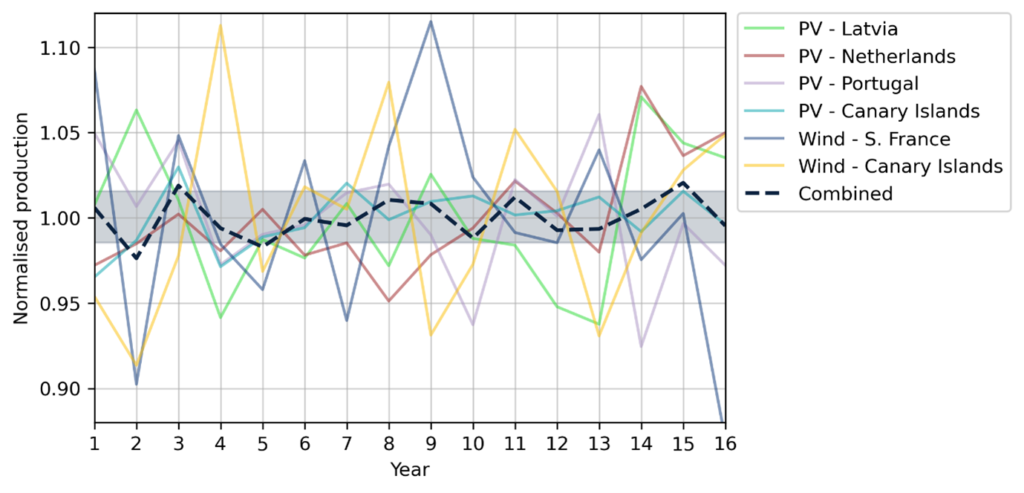
While co-location of wind and solar projects may be simpler (due to shared infrastructure, land and markets), the diversification of projects geographically can bring greater benefits at a portfolio level. As an example, looking at ‘traditional’ portfolio benefit approaches (ie, reduction of IAV), Table 1 below illustrates how an increasing number of technologies and projects can reduce the combined coefficient of variation (CV) of energy. Figure 7 below shows graphically the resulting combined portfolio IAV based on the six-project scenario.
Due to the nature of solar resource having a lower IAV than wind, we have forced the inclusion of wind projects in the analysis. It should also be noted that no scaling of project capacity / total generation is considered in this analysis and, therefore, the figures are based on a theoretical single 4.5 MW WTG for the wind projects, or a single 4.5 MWac inverter block for the solar PV projects.
| No. wind projects | 1 | 2 | 2 | 2 | 2 |
| No. solar PV projects | 1 | 1 | 2 | 3 | 4 |
| Total no. projects | 2 | 3 | 4 | 5 | 6 |
| Combined annual CV | 2.7% | 1.7% | 1.5% | 1.4% | 1.2% |
Table 1 – Reduction in combined portfolio CV for increasing portfolio size
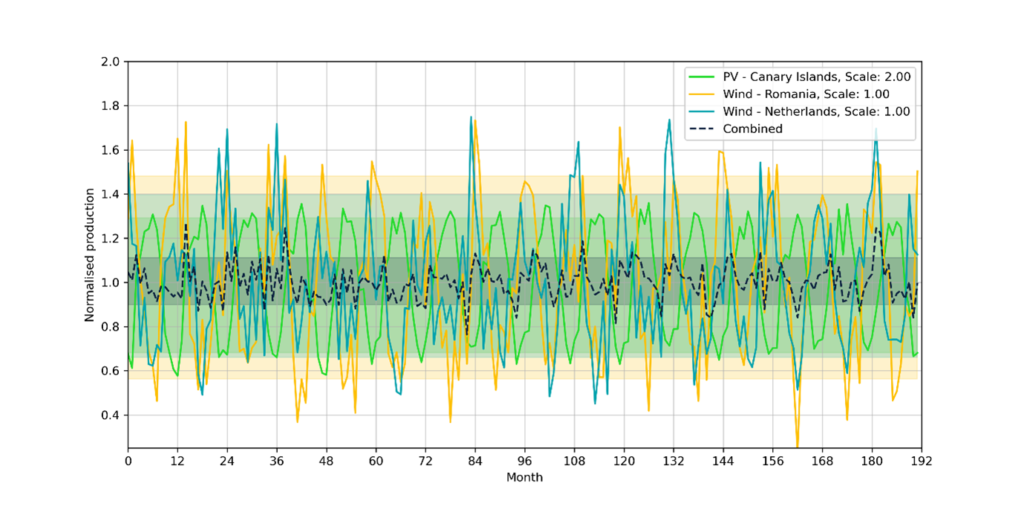
When higher temporal resolutions are considered with non-co-located projects, the benefits can be compounded. For example, IAV can be reduced in addition to monthly variability, where the right combination of projects can be identified. Through iterative modelling of wind and solar PV projects, in addition to scaling of project sizes, an example of a three-project complimentary scenario is given and presented in Figure 8 below. This shows the energy output of a 4.5 MW wind project in Romania, a 4.5 MW wind project in the Netherlands and a ~9 MWac solar PV project in the Canary Islands. Table 2 below summarises the CV based on 16 years of monthly data for the three projects individually, and the resulting CV of the combined portfolio.
| Project | Wind – Romania | Wind – Netherlands | Solar PV – Canary Islands | Portfolio |
| Monthly Coefficient of Variation | 33.9% | 28.7% | 23.6% | 8.3% |
Table 2 – Reduction in combined portfolio CV based on 16 years of monthly data
The combination of these projects displays the potentially large benefit that diversification can have on the sub-annual energy profiles of renewable energy portfolios.
Conclusions
In summary, there are wide-ranging benefits to be obtained by portfolios of projects through strategic diversification. This can be particularly valuable for portfolios with more complex PPA arrangements, especially when combining projects across multiple geographical markets.
While traditional renewable energy site-finding approaches may focus on the magnitude of the available resource, more advanced methods which include the analysis of resulting portfolio-wide benefits are becoming more commonplace.
In a world of increasing competition for high wind and solar resource, grid capacity and access to finance, coupled with the drive to reduce LCOE and the variability in energy generated by renewable projects, portfolio diversification should continue to be a key priority.
How ABL & OWC can help your projects
The wind and solar resource and energy yield analysis teams at ABL Group have decades of experience undertaking benefit analyses of this kind across the majority of key and emerging renewable energy markets. We offer full RE portfolio feasibility studies which include portfolio benefit analyses, and we can tailor these studies to cover regions, countries or full continents as required. We support developers, owners and lenders through technical due diligence and optimisation analysis and can advise on the most optimum solution for all our client’s needs.
Reference
[1] Solar data is from a theoretical 3.3 MWac single-axis tracking system in the Canary Islands, and the wind project is a theoretical 2 MW single WTG in the Netherlands. The profile is based on the average monthly energy yield from the two projects across a 16-year period 2005 to 2020.

By: Oliver Davies
Head of Onshore Wind